Thursday, January 28, 2010

DIve! Dive! Dive!


If you compare the 8000 tick above and the 20 minute below you'll notice that while the 8000 was giving a buy signal mid morning the 20 minute was signalling a lower market with "LML" about noon.

On the 480 minute chart below we have a serious event. We broke below the bottom trendline of the channel we've been trading in since August. We need to watch for a bigger sell-off and also a powerful upthrust. Exciting!

Looking at the 4000 tick chart below we get an idea that the volatility is picking as well as the spread. As they increase so do profit opportunities. And for our opponents the risk increases. AT 65 points per contract we're up to $3,200 profit per contract potential. Of course, we're just doing this for entertainment.

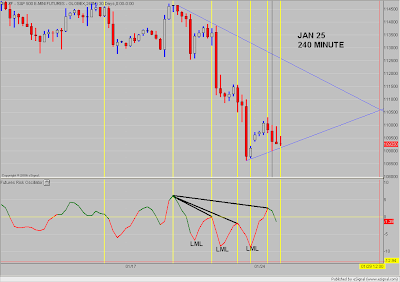
Below, the 240 minute gives us another view of that poke through support. There's a chance that we may get a bounce out of this area. I don't know now but I will know when it's time. Price action for the last three days appears to be probing for supply -- looking for buyers and demand.

WARNING: Trading futures involves risk. You can lose all of your capital and more. Consult with your financial adviser to determine if trading futures is suitable for you.

Wednesday, January 27, 2010

FOMC Gettin' It's MoJo Back


The 3000 tick chart above is from one year ago. I saved it because during the course of the day I took 3 trades based on using more sensitive charts. They were all losers. And you can tell just by looking at the 3000 tick how poorly they were executed and why they failed.

Response to previous FOMC minutes has been tepid the last several times. But today the market actually lit-up.

Tuesday, January 26, 2010

More Squeeze But ... A Little Bigger


Tight trading range. The spring is tightening.

We are on support in the bottom of the channel.


Some trades above and below.

The 20 Minute below gave us a heads-up before the open that we would have an up move. But you would not have thought it so by listening to the financial news.

Don't listen to the news.


Warning: Futures trading involves risk. You can lose all of your capital and more. Consult with your financial adviser to determine if futures trading is suitable for you.

Monday, January 25, 2010

Friday, January 22, 2010

Fear Is Our Friend


We are entering earnings season and combined with a record run in equities, we can expect some big day trading days ahead. There should be an increase of fear now that will give way to some big swings in price. And that's how we profit.

Well we're out of that tight trading range and we will probably see higher prices once we get some back and forth momentum going.

The FRO did a good job keeping us going with the herd.

Three down days on the board above.

The Monthly above looks like we're still headed higher.

The Weekly was trying to tell us we had a pullback coming. And it finally came.

The Daily also gave us a good heads up on the pullback.

The 480 Minute looks pretty frightening. Each candle has a 480 minute duration.

But when we take in the last five months price is still comfortably within an upward channel. Notce what price did after touching the bottom of this channel each time.

And this is my favorite chart. This illustrates the profit potential for today.
Nobody makes this kind of money in a day... unless they know how to read buying and selling pressure.
And that's ALL that matters.
So is there anything more important to learn or know?


WARNING: Futures trading involves extreme risk. Consult with your financial adviser to determine if trading futures is suitable for your situation. These illustrations are for entertainment purposes only and do not represent any guarantee of future performance.
The Last Hope Trader does not offer any financial advice and assumes no responsibility for visitors' financial decisions.


Thursday, January 21, 2010

Tuesday, January 19, 2010

Big Picture Little Picture


We are confirming support above the 1128 50% level.

Overnight traders probed down to 1128 and found demand by 8am.

We had about 24 hours of notice that price would go up this morning. Then after the open we developed another HMH to confirm the day's direction.

A fast moving shakeout before the open gave us about a 90 minute heads up that price would move upward after the open.

Zooming in we can see clear cross confirmation on the 2400 tick chart and others. We had a series of buy signals all day.

And as the day went on we kept popping to the upside.
WARNING: Futures trading involves risk. You can lose all of your capital and more. Consult with a financial adviser to determine if trading futures is suitable for you.

Saturday, January 16, 2010

Nice Break


A nice top formation was in process just before 5am. By the time the market opened it was ready to go. The premarket action netted about 10 points.

Below is a condensed view of the 20 minute chart.


So the day netted about 40 points per contract or $2,000 per contract.
A profit potential of $2,000 to $20,000,000.

WARNING: Trading futures involves risk. You can lose all of your capital and more. Consult your financial adviser to determine if futures trading is suitable for you.

Tuesday, January 12, 2010

How Long Will This Go On?


I hope we didn't trade one sideways channel for a new one.

We have a potential warning in the LML above. It may be forecasting a bigger pullback.
Keep watching.
Today was a relaxing day of trade with very little chop and a nice verticle point run.

WARNING: Futures trading involves risk. You can lose all of your capital and more. Consult your financial adviser to determine if futures trading is suitable for you.
All information on this website is for entertainment purposes only.

Friday, January 8, 2010

Groundhog Day..... Again

Today was a ditto of yesterday. Hard selling before the open followed by squeezing and popping all day to new highs.
At 8:30 the Non Farm Payroll report triggered a sell-off.

On the weekly chart below that little buy signal we saw yesterday played out...again.
And yes the Santa Claus Rally is still going.... a little at a time. It's a great pace for the long term portfolio but it sucks for day trading.


On the bright side.... No person on earth, (that's incredible) has ever traded this particular type of market. We broke every record one year ago for a falling market. And now there is a lot of nervousness about getting caught at the top.
So we have this pattern repeating. I sure hope it doesn't last. The volume is high. But the longs are neutralized to a large extent by shorts. So they're in a holding pattern for much of the day.