Thursday, December 30, 2010

2011


Looking at the pre-Fed era, the US consumer price index (CPI) declined at an annual average of 0.5% and real gross domestic product (GDP) grew at an annual 4% during 1800-1912; this would have been labeled grave deflation by Bernanke and would have been considered as a danger to the economy.

During the Fed era, the CPI rose at 3.5% per year and real GDP at 3.25% per year during 1913-2009. Hence a dollar bought almost twice as much goods in 1912 as it did in 1800; and in 2009 it bought less than 5% of the goods it bought in 1913.

http://www.atimes.com/atimes/Global_Economy/MA04Dj01.html

A private central bank issuing the public currency is a greater menace to the liberties of the people than a standing army. ‘We must not let our rulers load us with perpetual debt.’
Thomas Jefferson

Taleb Interview on Bernanke, QE

Nov. 12 (Bloomberg) -- Nassim Taleb, New York University professor and author of "The Black Swan: The Impact of the Highly Improbable," discusses the Federal Reserve's decision to initiate another round of quantitative easing. Taleb, speaking with Erik Schatzker on Bloomberg Television's "Inside Track," also talks about his new book "The Bed of Procrustes: Philosophical and Practical Aphorisms." (Source: Bloomberg)
http://www.bloomberg.com/video/64477298/

Nov. 10 (Bloomberg) -- Jim Rogers, chairman of Rogers Holdings, and Bethany McLean, a Bloomberg contributing editor, discuss Federal Reserve Chairman Ben S. Bernanke's job performance and policy decisions. Rogers, speaking from Singapore, and McLean, speaking from Louisville, Kentucky, talk with Betty Liu on Bloomberg Television's "In the Loop."
http://www.bloomberg.com/video/64407998/

©2010 BLOOMBERG L.P. ALL RIGHTS RESERVED.

Thursday, December 9, 2010

Thursday, December 2, 2010

Wednesday, December 1, 2010

Don't Try This At Home


I woke up at about 2 am (I had taken a nap the afternoon before)My dog likes the quality time alone with the food guy. Waking up at night is getting to be a habit... that pays lately.

With the squeeze showing signs of breaking out, I assumed it would be a one-way day. And as we know one-way days are notorious for shitty buy and sell signals because there are no pivots -- no opposition to the trend.
So I dialed down to a 3 minute chart to get a little zoomed-in and saw a nice buy signal at 3 am.

It cross confirmed nicely with HMH's on my standard 4000, 5000 and 8000 tick charts so I took it.

The rest is history.


WARNING!: I only use the 3 minute chart to confirm something I see taking shape on the longer interval charts. If you try to force a trade by looking for a formation on the 3 minute -- instead of patiently waiting for the longer interval charts to show a buy/sell signal, you will get sucked into numerous false signals and will lose money. Do not focus on the 3 minute as an anchor chart.

Hope You Were Up Early


We got our break-out today but you had to show-up at about 3am to catch a clean buy signal before the open at 9:30.
I always get a kick out of the commentators who cite news of the day as the catalyst for a strong move like this one.
We knew at the last close where this market was going as mentioned in the post below.
We were in a tight squeeze on a shallow correction. It was just time for the spring to pop.

Tuesday, November 30, 2010

C'Mon! It's Time For A Pop!


Support has been holding for a looong time now. I'm ready for a break... and I hope it's to the upside.


I used the 4000 and 5000 tick charts to execute a few pivots but I used the 8000, 10,000 and 12,000 ticks below to define the general playing field. Then when I saw those classic buy and sell signals on the 4000 and 5000, I was ready to execute.


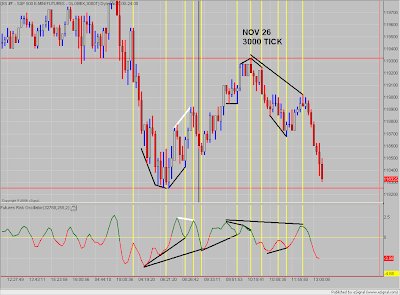
Friday, November 26, 2010

Black Friday


Couple of g's for the shoppin' spree.

Wednesday, November 24, 2010

Tuesday, November 23, 2010

Tick Chart or Minute Chart?

These first three "minute interval" charts worked well today in the squeeze trade as the market was trying to establish a bottom. When compared to the many other charts below you can see that these three gave you clarity and clean, trade-able formations.
It's pretty amazing that using the only the FRO, and creating a wide variety of intervals, you can always find a combination that allows you to take money home.


The 30 minute chart below gave you a good perspective to see that a bottom was forming all day.

The remaining charts below were not very useful for executing specific trades.
Some were only useful in helping you see the squeeze action.