Tuesday, November 30, 2010

C'Mon! It's Time For A Pop!


Support has been holding for a looong time now. I'm ready for a break... and I hope it's to the upside.


I used the 4000 and 5000 tick charts to execute a few pivots but I used the 8000, 10,000 and 12,000 ticks below to define the general playing field. Then when I saw those classic buy and sell signals on the 4000 and 5000, I was ready to execute.


Friday, November 26, 2010

Black Friday


Couple of g's for the shoppin' spree.

Wednesday, November 24, 2010

Tuesday, November 23, 2010

Tick Chart or Minute Chart?

These first three "minute interval" charts worked well today in the squeeze trade as the market was trying to establish a bottom. When compared to the many other charts below you can see that these three gave you clarity and clean, trade-able formations.
It's pretty amazing that using the only the FRO, and creating a wide variety of intervals, you can always find a combination that allows you to take money home.


The 30 minute chart below gave you a good perspective to see that a bottom was forming all day.

The remaining charts below were not very useful for executing specific trades.
Some were only useful in helping you see the squeeze action.


Monday, November 22, 2010

Up Or Down?

With today's sideways trade we don't have clarity on the longer term direction for this market. Looking at the daily chart we can go either way. Yet we had clear signals for today's trade. I was pleased to see the amount of activity in spite of the coming holiday. It should be a good week for volume with pending economic reports and global activities.


Friday, November 19, 2010

I'm Becoming Nocturnal

I woke up at 2am and my service dog was waiting for me when I came out of the the bathroom with a look as if to say, "What are WE going to do now?" So I checked the charts and was able to see the sell signal (lousey signal) up at 1200. Since it was a long choppy day, I decided to just use three chart intervals to minimize the brain drain. My policy is, if I don't see a set-up using just three or four intervals then I don't take any trades. As it turned out these three were sufficient to see where things were going. Badda Bing Badda Bang!


The FRO on the daily chart is totally screwed-up. But it appears that yesterday and today were about plunging or testing to see if there is excess supply or if buyers would come in. Both days ended at or above the open after plunging to hit buy orders.

Thursday, November 18, 2010

Grrrrrr!!

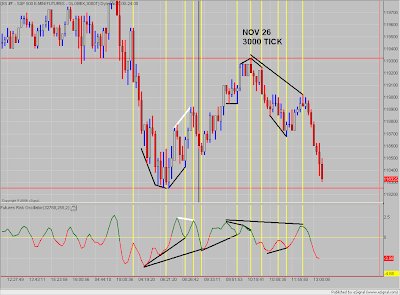
I hate it when the market party's without me! So we got less than half of the move that started just before yesterday's close. At least we had a clear entry at the open today. But if you look closely, we only had two perfect signals to deal with the pullback and the buy signal going into the close. Check the 5000 tick for the sell signal and the 8000 tick for the buy signal.