Tuesday, November 16, 2010

Seeing Is Believing

It's important to utilize a wide variety of the tools in order to get the correct perspective. Today was predictable in that we've been finding resistance for a while and it's time for a pullback after the excellent September and October performance.

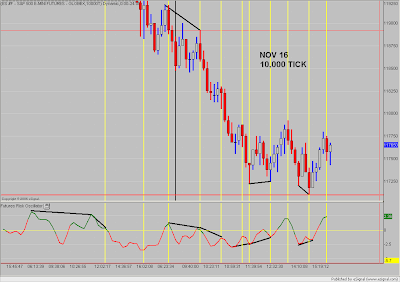
For the most part I use the 10,000 tick, 8000 tick, 5000 tick and the 4000 tick.
But before the market opens it's critical to look at the various chart intervals below to see what the FRO is saying.


The sell signal on the 90 minute above gives you an unfair advantage over other traders. When you have a high confidence level base on good signals you can put on a large number of contracts and produce profits much faster. If it's not a clean signal then you can either let it go or just use one or two contracts.


As you can see on the 480 minute above we were due for this reversal and we are well off of any support level. If we are to go on to higher highs we're going to need to build a base at some level.

The best way to determine if price is going to chop around is to observe the FRO in relationship to the price action. The two charts above clearly distiguish between clean signals and distorted signals. I usually just let them go by and wait and watch.


No comments:

Post a Comment