“Monkeys and rats have a certain advantage over humans, and that is they do not read the newspaper and do not look into the news, and they do not get fooled by that; they really just look for randomness or technical signals,” he told RT.
Saturday, February 14, 2015
Rats of Wall Street: Rodents taught to trade in foreign exchange markets


Thursday, June 5, 2014
Buy In May And You Better Stay!


Sunday, April 13, 2014
It's time to protect profits and capital: We are in correction mode


In the S&P 500 we have confirmed sell signals on the;
Quarterly
Monthly
Weekly and
Daily Charts.
The last correction of May - November 2011 was 300 points.
I believe we are headed to at least the 1600-1560 level of the mini S&P.
That is the top of the 13 year sideways channel between 2000 and 2013.
It's also the new floor that will support future rallies.
So we have in fact begun "Sell in May go away" this past week.
It's time to take profits and preserve capital.
Wednesday, April 2, 2014
APRIL FOOLS!
Another breakout day. Price action has been squeezing and chopping for weeks. Today, April 1 price broke out that long pattern and headed north. We are at a point where price is going to move more forcefully -- Up or Down remains to be seen. But we'll know in a few days.


Wednesday, March 26, 2014
I Hate Record Highs
I hate record highs because it seems traders are reluctant to go into uncharted territory. But in any case, despite the sluggishness in activity, there is still money to be made. I have not put any notes on today's charts. They are pretty self-explanatory. We have been going sideways and we may continue. Hopefully we'll get a break -- either way -- up or down. For some fast money.


Friday, March 21, 2014
March 21st Quadrupel Expiration
We're in record territory and dealing with skittish traders. Today was another waiting game for the best moves. The well announced sell off came just before noon and lasted for hours.


Thursday, March 6, 2014
The Wall of Worry


Monday, February 24, 2014
The Breakout: But Will It Hold?
We've finally broken above the sideways channel that started way back in December on the 23rd.
Today is the first time we've exceeded the 1845 level in the mini S&P 500.
Great news.
But my gut tells me it just might be a trap. A pop above the resistance level is sometimes just a maneuver to suck traders into a long position, only to slam them with heavy selling. i have no technical reason to believe that -- it's just a hunch right now.
We will see.
For today we've had a nice clean run from last night's low around 1830 to almost 1847.
A good day.
Right Click, "View Image" to enlarge chart.
Right Click, "View Image" to enlarge chart.

Friday, February 7, 2014

Wednesday, February 5, 2014


Saturday, January 25, 2014
I'm Baack!
Ok. So we've experienced a ridiculous rally since March 9, 2009 from '666' in the S&P. And now we're at the all time high territory near 1800.


Now we are about to deal with a series of pullbacks, I believe. I'm looking for the ultimate pullback to 1540-1560 which was the thirteen year resistance level - broken for the first time ever back in May 2013.
Once we go down and confirm that new level of support I think we'll see a very long term bull market lasting 5 to 10 years.
Saturday, September 10, 2011


Sunday, August 7, 2011
Happy Days!... For Day Traders
Monday: The Wind-up...

Tuesday: The Pitch...


Wednesday: The Bounce...


Thursday: Home Run!


Friday: Waiting For The Other Shoe...


Tuesday: The Pitch...


Wednesday: The Bounce...


Thursday: Home Run!


Friday: Waiting For The Other Shoe...


Wednesday, June 1, 2011
Yastro: "We Are on the Verge of a Great, Great Depression"....
http://www.zerohedge.com/article/yastrow-%E2%80%9Cwe-are-verge-great-great-depression%E2%80%9D
OK. Let's all calm down now. This market is ready to take a hooter off the deep end...
Last Friday we were up against the down trend line for the fifth time in a month.

Yesterday we broke through that trend line and were left with an LML -- a dip lower in the FRO that signals price going lower than 1300. 
Today we had an upthrust overnight that sucked in the buyers -- only to hit them with selling pressure. Stop loss orders were hit on the way down forcing all the longs to cover by selling. Thus the multiple bouts of selling. It was a one-way day. 
Friday, May 27, 2011
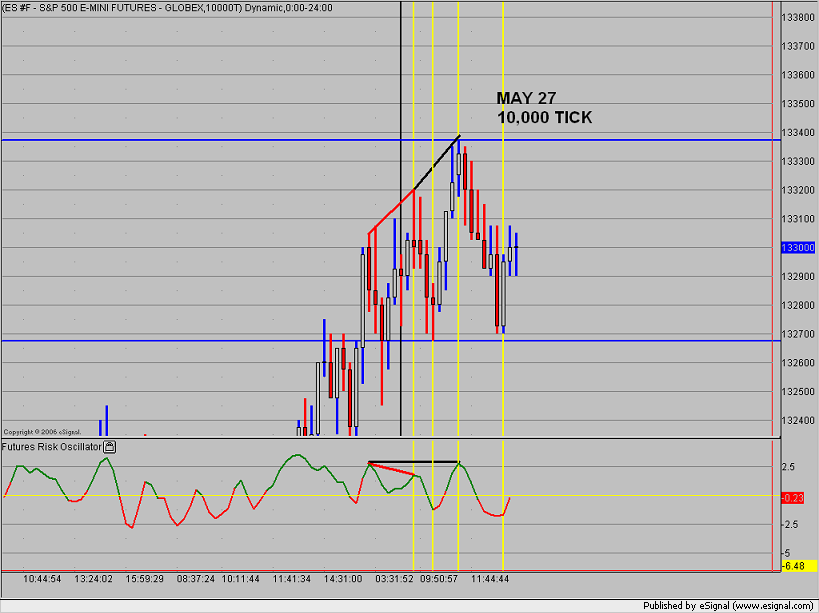
Deal - No Deal
A quiet day before the Memorial Day weekend. But look down at the Daily chart and you'll see a trendline going down that withstood buying activity once again after many tests.
But I don't think the rally is going to go away for much longer. Watch for a head fake to the upside next week.


But I don't think the rally is going to go away for much longer. Watch for a head fake to the upside next week.